Is MedTech Getting More Affordable?

Affordability
Healthcare affordability matters. As a patient, I care about affordability—but as an innovator, I care about it even more. If essential healthcare products become luxury goods, we all lose.
This conversation is often dominated by skyrocketing drug prices, with infamous cases like Martin Shkreli’s move to license the antiparasitic drug, Daraprim, and raised its price to insurance companies from $13.50 to $750.00 (USD) per pill. Add branded drugs, insurance formularies, and coverage gaps, and the problem gets even harder to solve.
But while therapeutics get the headlines, what about medical devices?
In this post, I’ll look at 10 years of pricing data from the Federal Reserve Economic Database (FRED) to see whether medical devices are suffering the same affordability crisis as drugs—or if the trend is different.
Producer & Consumer Price Indices
Remember that Econ class you took? Yeah, me either. Let’s get a refresher.
The Producer Price Index (PPI) measures the average change in prices that manufacturers and suppliers receive for their goods over time, reflecting wholesale price trends before products reach consumers. We’ll use data from FRED to look at the PPI for Medical, Surgical and Personal Aid Devices.
The Consumer Price Index (CPI), on the other hand, tracks the prices that consumers actually pay, making it a key measure of inflation at the household level. FRED also maintains CPI data.
By comparing MedTech PPI to CPI, we can assess if medical device prices are truly rising, or if they simply appear to be increasing due to broader inflation. By adjusting PPI using CPI, we can isolate real price changes.
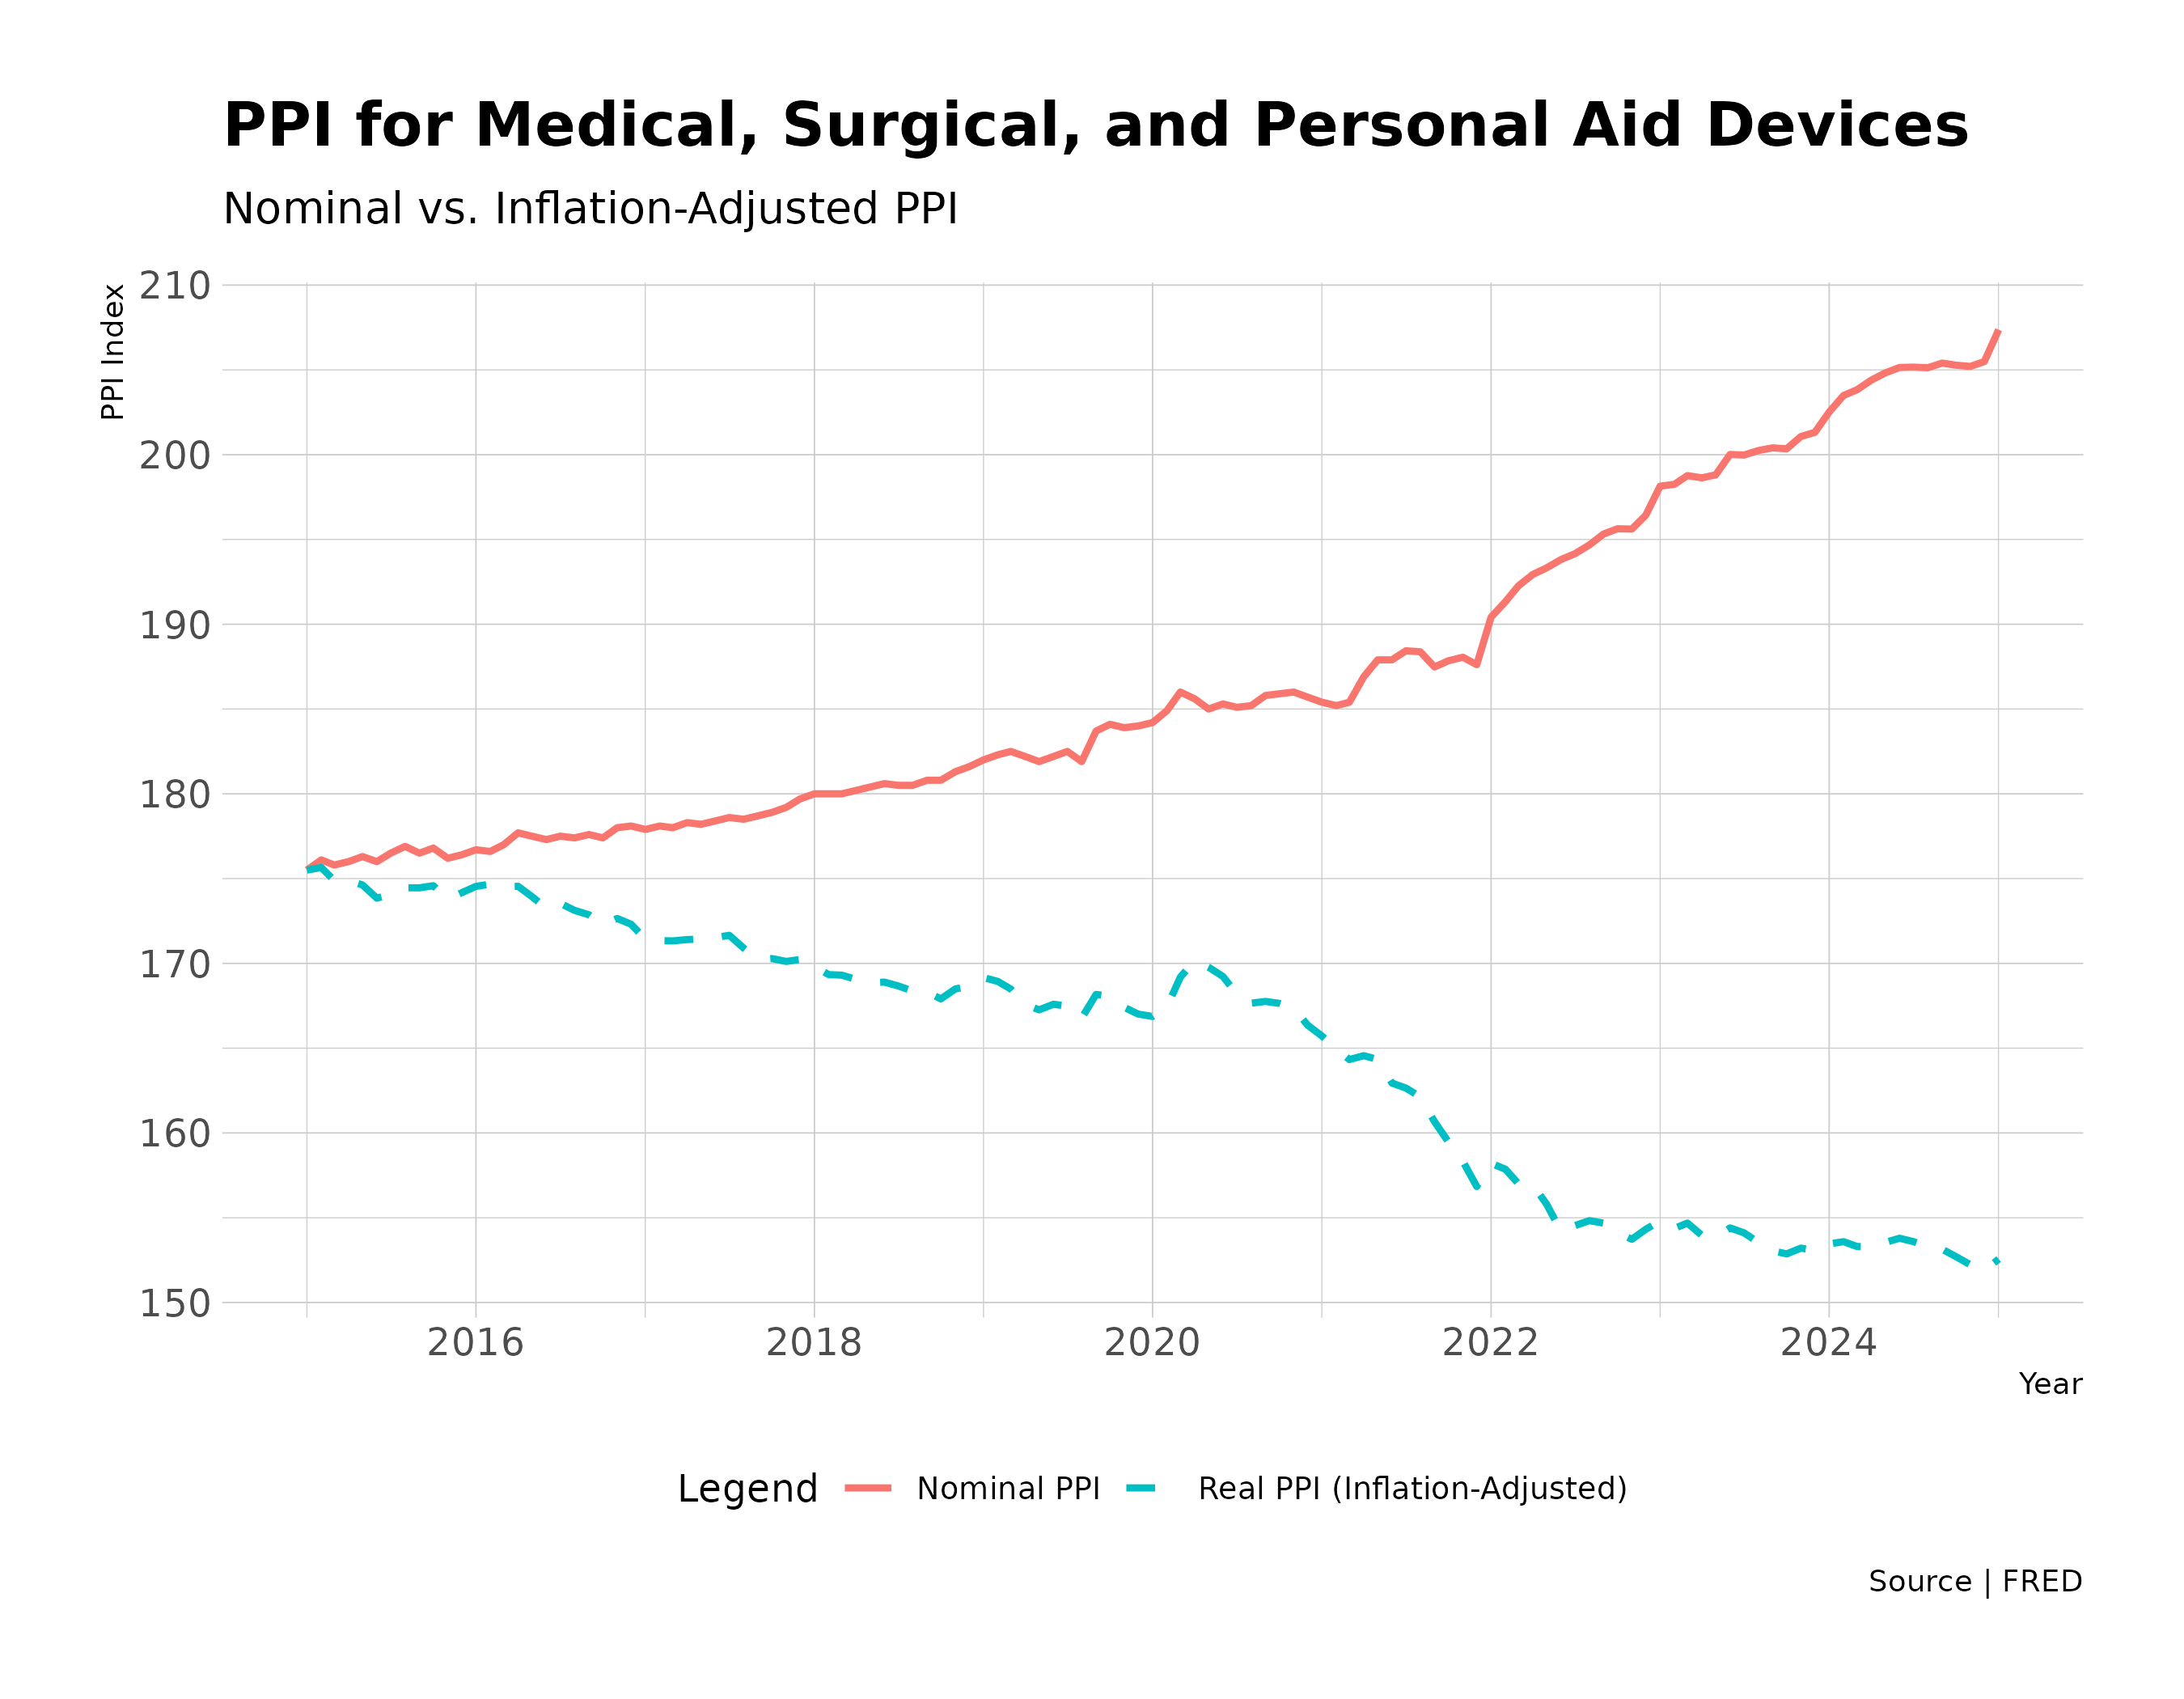
Figure 1: MedTech Prices Over Time
What This Means for Healthcare
When I first started looking at the PPI data, I thought it would be the same story as drug prices—medical device prices are rising. But when looking at real prices, compared to everything else in the economy, medical devices are getting cheaper, not more expensive.
Why? General inflation has outpaced MedTech price growth. Costs for labor, raw materials, and energy have surged, but MedTech companies haven’t passed that along. Instead, they’re absorbing some of the hit—probably due to competition, insurance reimbursement limits, and hospital pricing pressure.
At the same time, efficiency gains in manufacturing automation, 3D printing, and smarter supply chains are helping keep costs down. Companies are figuring out how to make devices cheaper and faster without sacrificing quality.
What This Means for MedTech
Lower prices are great for hospitals and patients, but what about MedTech companies? If their costs keep rising but they can’t raise prices, something has to give. That means they’ll have to get creative—maybe by shifting to subscription-based software, bundling services, or workforce changes.
The big question: Can MedTech keep innovating while staying affordable? If prices keep dropping in real terms, how do companies fund the next generation of medical devices? MedTech is already focused on high-revenue areas like cardiovascular, surgical, and vascular specialties (see previous blog post). If margins stay tight, unmet needs in pediatrics will be even harder to innovate for.
Code
library(tidyverse)
library(janitor)

ppi <- read_csv("~/Documents/blog/content/post/2025-02-21-medtech-is-getting-more-affordable/source_data/WPS156.csv",
                   name_repair = make_clean_names)
cpi <- read_csv("~/Documents/blog/content/post/2025-02-21-medtech-is-getting-more-affordable/source_data/CPIAUCSL.csv",
                   name_repair = make_clean_names)

# Ensure date columns are in Date format
ppi <- ppi %>%
  mutate(date = as.Date(observation_date)) %>%
  select(date, wps156) # Keep only relevant columns

cpi <- cpi %>%
  mutate(date = as.Date(observation_date)) %>%
  select(date, cpiaucsl) # Keep only relevant columns

# Join the two datasets on 'date'
data <- ppi %>%
  inner_join(cpi, by = "date")

# View the first few rows
head(data)
## # A tibble: 6 × 3
##   date       wps156 cpiaucsl
##   <date>      <dbl>    <dbl>
## 1 2015-01-01   176.     235.
## 2 2015-02-01   176.     235.
## 3 2015-03-01   176.     236.
## 4 2015-04-01   176      236.
## 5 2015-05-01   176.     237.
## 6 2015-06-01   176      238.
library(hrbrthemes)

# Set base CPI (e.g., first available month, January 2015)
base_cpi <- data$cpiaucsl[1]

# Calculate inflation-adjusted PPI
data <- data %>%
  mutate(real_ppi = wps156 * (base_cpi / cpiaucsl))

# Plot Nominal vs. Inflation-Adjusted PPI
plot_ppi <- ggplot(data, aes(x = date)) +
  geom_line(aes(y = wps156, color = "Nominal PPI"), size = 1) +
  geom_line(aes(y = real_ppi, color = "Real PPI (Inflation-Adjusted)"), size = 1, linetype = "dashed") +
  labs(title = "PPI for Medical, Surgical, and Personal Aid Devices",
       subtitle = "Nominal vs. Inflation-Adjusted PPI",
       x = "Year",
       y = "PPI Index",
       color = "Legend",
       caption = "Source | FRED") +
  theme_ipsum_rc() +
  theme(legend.position = "bottom", legend.direction = "horizontal")

ggsave("images/plot_ppi.png", plot = plot_ppi, width = 9, height = 7, dpi = 300)