Digital Therapeutics
Player 2 Has Joined the Game
The idea of a digital therapeutic seems like an area with tons of potential. Mobile apps and ‘smart’ tech are ubiquitous. Add advances in data science and focus on big unmet needs, like mental health.
Drugs are hard to development — risky and expensive. See the figure below with a fantastic analysis of the cost of bringing drugs to market from 2009 through 2018 [@jama].

Still, there are biological limits on what one can achieve with digital interventions. Time will tell if it’s hype or real potential.
What are Digital Therapeutics?
Here is one definition given by the Digital Therapeutics Alliance:
Digital therapeutics (DTx) deliver medical interventions directly to patients using evidence-based, clinically evaluated software to treat, manage, and prevent a broad spectrum of diseases and disorders.
EndeavorRx
Attention-Deficit / Hyperactivity Disorder (ADHD) is a common neurodevelopmental disorder, in children but also undiagnosed adults. While there are medications for treatment, for some, they carry significant side effects. Also it can be hard to titrate to the right dose.
Enter EndeavorRx — an FDA-Approved game for treatment of ADHD. Yes, game. What a clever approach. Right now, EndeavorRx doesn’t supplant the use of other therapies, it’s used in combination with them. What I love about this is it doesn’t take a leap of faith to see kids using it. Who doesn’t love to play games?
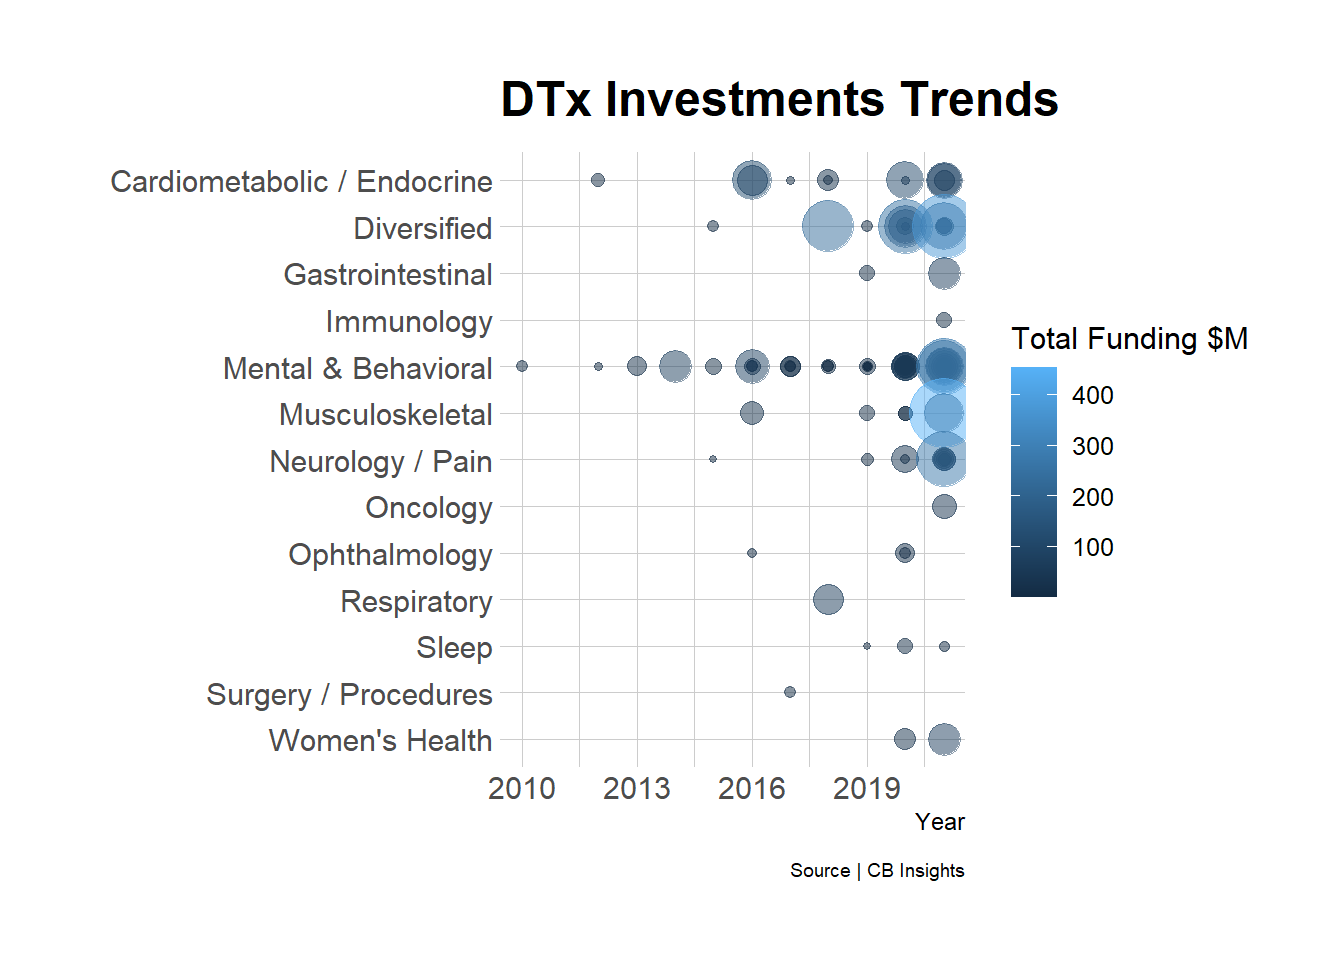
DTx Data Trends
Curious about the bigger picture, I sourced data from CB Insights to look at trends in private investment, product development and associated areas of focus. These companies fall under the DTx alliance definition mentioned above. Let’s take a look:
# Pull in data, clean name headers
dtx_comp <- read_csv("data/Digital Therapeutics - Companies.csv",
                     name_repair = make_clean_names)
# Create new df
ct_tbl <- dtx_comp %>%
  # Convert 'Primary Focus Areas' to factor
  mutate(area = factor(primary_focus_area_s)) %>%
  # Convert to year only
  mutate(yr = year(latest_funding_date)) %>%
  # Merge 'N/A' into NA
  mutate(area = na_if(area, "N/A")) %>%
  # Group companies, focus area and funding, count
  group_by(area, total_funding, yr, companies) %>%
  count(area) %>%
  # Drop NA values
  na.exclude

# Create plot
ggplot(ct_tbl, aes(x = yr, y = area, size = total_funding)) +
  geom_point(alpha = 0.5, aes(color = total_funding)) +
  scale_y_discrete(limits=rev) +
  scale_fill_viridis_c(option = "G") +
  scale_size(range = c(1,12), guide = 'none') +
  theme_ipsum_rc() +
  theme(legend.position = "right",
        plot.caption = element_text(size=7)) +
  labs (title = "DTx Investments Trends",
        x = "Year",
        y = "",
        color = "Total Funding $M",
        caption = "Source | CB Insights")
# Create new df
areas <- dtx_comp %>%
  # Change to factors
  mutate(area = factor(primary_focus_area_s)) %>%
  # Declare 'N/A' as 'NA'
  mutate(area = na_if(area, "N/A")) %>%
  # Group cases by area
  group_by(area) %>%
  # New table by specialty count
  summarize(area_ct = n()) %>%
  # Sort by descending
  arrange(desc(area_ct)) %>%
  # Include only specialties with > 1 product
  filter(area_ct > 1) %>%
  # Do not include 'Diversified' category
  filter(!area == "Diversified") %>%
  # Remove NA values
  drop_na(area)
# Dummy group variable for single stacked bar
areas <- areas %>%
mutate(Yr = "2021")
# Define percentages by area
areas$percent <- (areas$area_ct/sum(areas$area_ct)) * 100
# Generate single percent axis plot by specialty area
ggplot (areas, aes(x = Yr, y = area_ct, fill = area)) +
geom_bar(stat="identity", na.rm = FALSE) +
# Change from vertical to horizontal
coord_flip() +
# Add font theme, remove bg grid
theme_ipsum_rc(grid = FALSE) +
# Set y scale (x coord_flip) by 25% ticks
scale_y_continuous(breaks = seq(0, 100, by = 25)) +
# Add accessible color palette, remove name of legend
scale_fill_viridis_d(name = NULL, option = "D") +
# Move legend to bottom
theme(legend.position = "bottom") +
# Remove dummy axis labels
theme(legend.text=element_text(size=8),
plot.caption = element_text(size=7),
axis.text.y=element_blank(),
axis.title.y = element_blank(),
axis.ticks.y = element_blank()) +
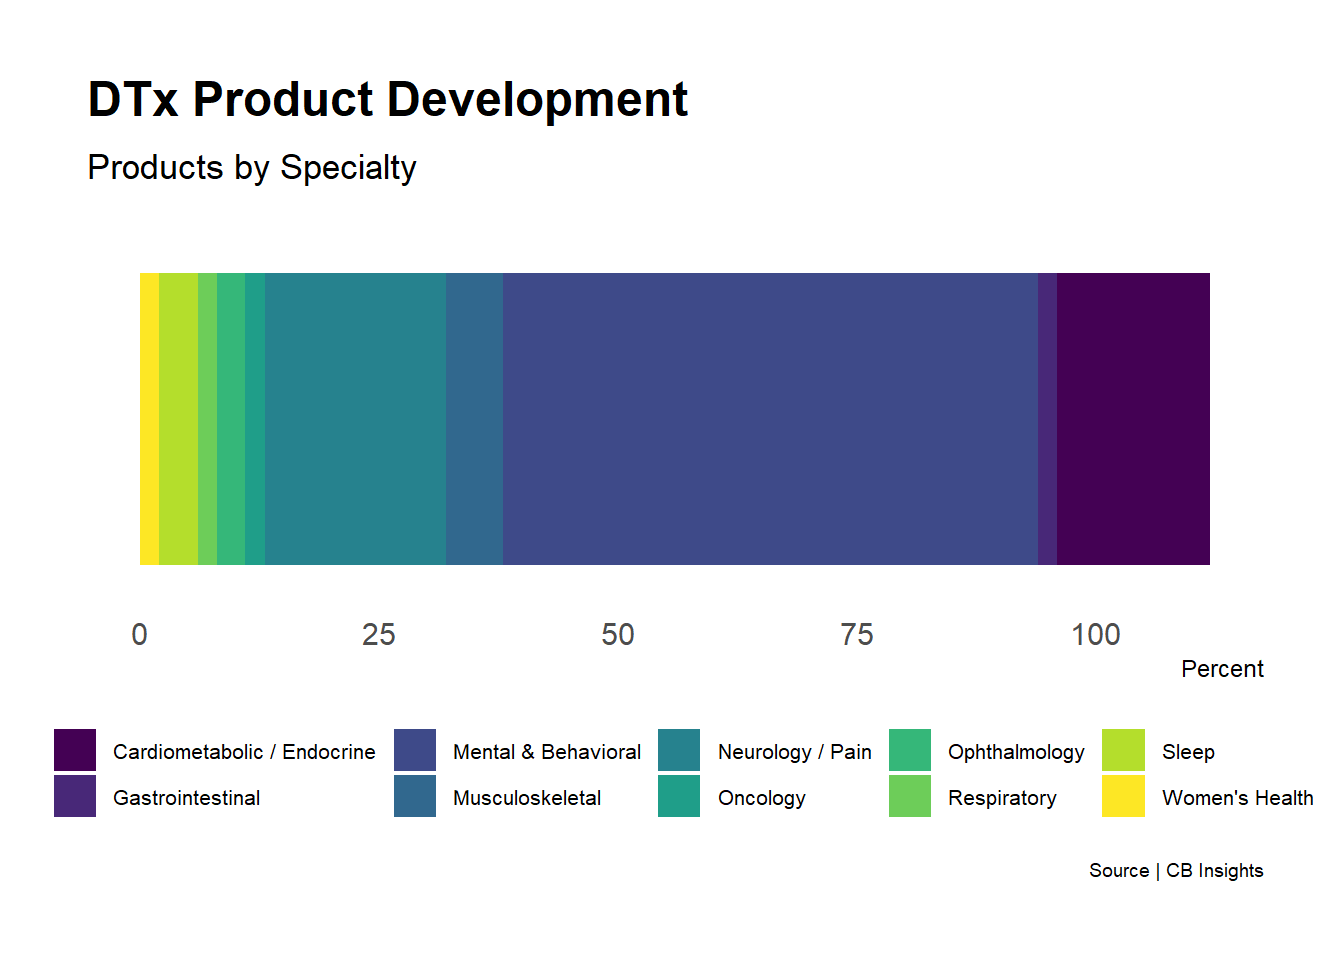
labs(title = "DTx Product Development",
subtitle = "Products by Specialty",
y = "Percent",
caption = "Source | CB Insights")
# Define new geocoded dataframe
dtx_loc <- dtx_comp %>%
  # Geocoding address from df using library("tidygeocoder")
  geocode(street = street,
          city = city,
          state = state,
          postalcode = zip_code,
          country = country,
          # Use cascade to iterate through geocoding services (e.g., census, osm)
          method = 'cascade',
          # Return df with geocoded variables added
          return_input = TRUE)
# Define US shape map
us_sf <- map_data("state")

# New simplified df
dtx_geocoded <- dtx_loc %>%
  select("lat", "long", "total_funding", "companies", "primary_focus_area_s") %>%
  arrange(desc(total_funding)) %>%
  na.exclude
ggplot() +
# Render US shape map with lat, long
geom_polygon(data = us_sf, aes(x = long, y = lat, group = group), fill = "grey", alpha = 0.3) +
# Add bubble plot for DTx investments, geocoded
geom_point(data = dtx_geocoded, aes(x = long, y = lat, size = total_funding, color = total_funding)) +
# Add state borders
borders("state") +
# Add scale, remove duplicate legend
scale_size_continuous(range=c(1,20), guide = 'none') +
# Add accessibility color palette
scale_color_viridis(option = "D") +
# Add Roboto Condensed theme, remove xy grid
theme_ipsum_rc(grid = FALSE) +
# Remove xy axis title, text
theme(plot.caption = element_text(size=7),
axis.text.y = element_blank(),
axis.title.y = element_blank(),
axis.text.x = element_blank(),
axis.title.x = element_blank(),
legend.position="left") +
# Add coordinate map
coord_map() +
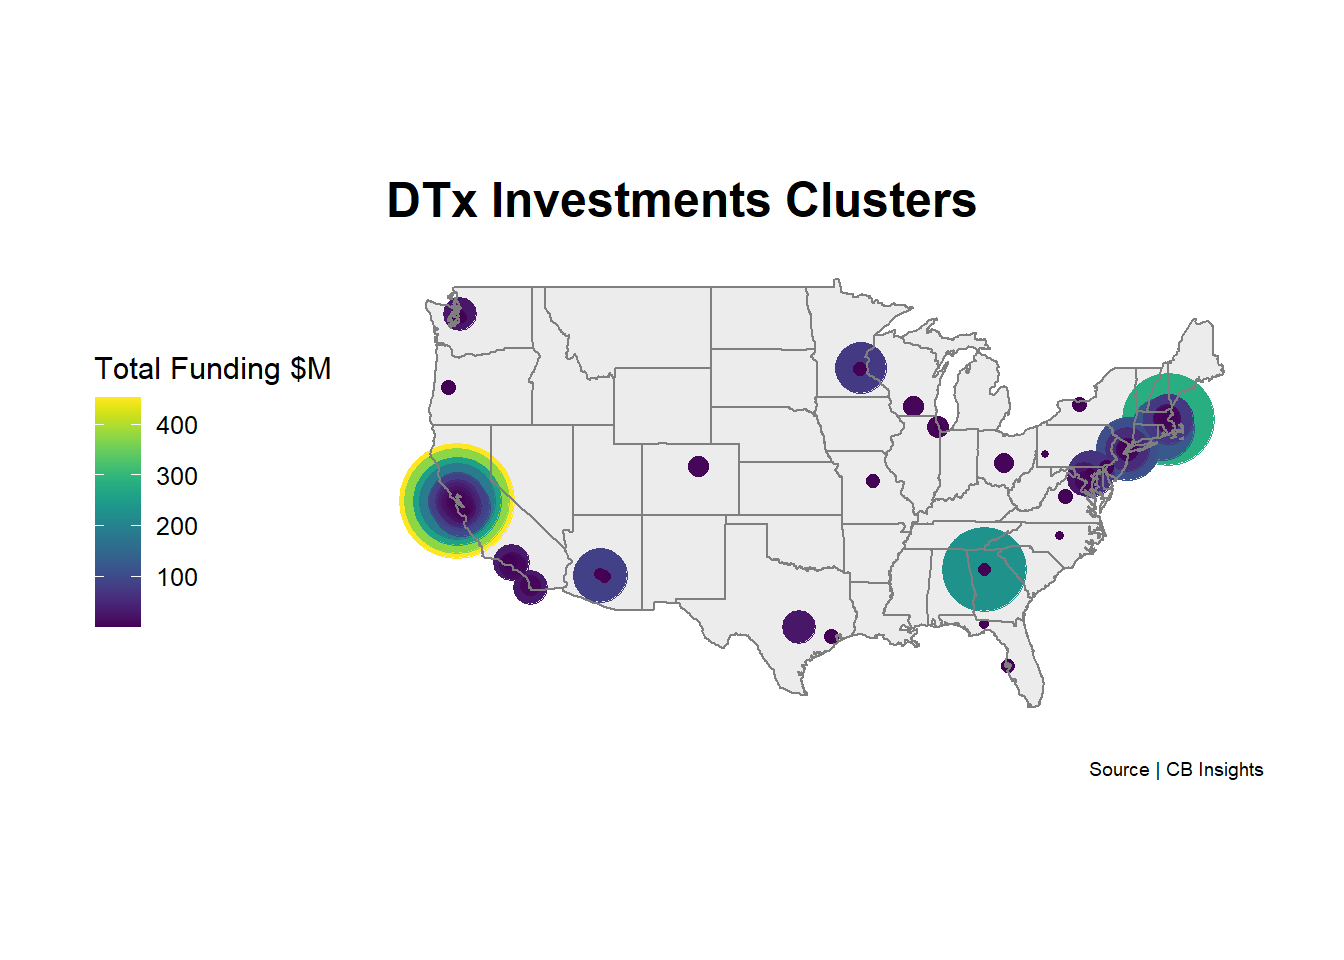
labs(title = "DTx Investments Clusters",
color = "Total Funding $M",
caption = "Source | CB Insights")
Women’s Health
Women’s Health is an underserved area, both medicine and healthcare innovation. I thought I’d include those companies focused on this area:
dtx_comp %>%
  filter(primary_focus_area_s == "Women's Health") %>%
  select(companies, description) %>%
  datatable(rownames = FALSE, colnames = c("Company", "Description"), caption = "DTx for Women's Health", options = list(dom = 't'))
Renovia
Pelvic floor disorders are a huge problem, compounded by their complexity to treat. I’ve had the opportunity to work on several projects in this space, everything from endometriosis, vulvodynia and chronic pelvic pain. As hard as these can be for providers to treat effectively, patient access and education is equally challenging. For some, stigma around treatment is a difficult barrier to break through [@Zoorob2017-zt].
Renovia is taking an interesting approach, by way of a medication-free option for pelvic floor health and urinary incontinence. Looks like they completed a pilot study in May 2021 showing benefit for fecal incontinence.
Mental Health
By far the biggest area is mental health, another huge need. Often ‘dirty’ pharmacology, tradeoffs in the form of side effects, and consequently poor adherence. This seems the most translatable area based on renewed interest in telemedicine (thanks COVID!) and proven interventions like cognitive behavioral therapy (CBT). For those interested, table below with all mental health companies and their products.
dtx_comp %>%
  filter(primary_focus_area_s == "Mental & Behavioral") %>%
  select(companies, description) %>%
  datatable(rownames = FALSE, colnames = c("Company", "Description"), caption = "DTx for Mental Health", options = list(pageLength = 5))